This is an old revision of the document!
Table of Contents
SMART ALTITUDE WebGIS: overview of available functions
Getting Started
Access to SMART ALTITUDE WebGIS:
![]()
To go to the SMART ALTITUDE WebGIS startpage, type into your browser adress bar: www.smartaltitude.eu OR use your search machine looking for SMART ALTITUDE WebGIS.
Choose your language

Choose your preferred language directly above. You can choose between English, German, French, Italian and Slovenian. Please note, that layer attributes are only available in their original language English.
About SMART ALTITUDE
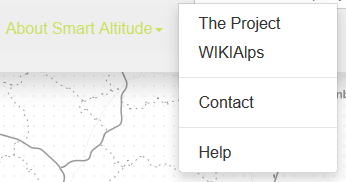
Clicking on “About SMART ALTITUDE” in the grey bar on top of the website, it gives you the links to the SMART ALTITUDE project homepage as well as to WIKIAlps. On the SMART ALTITUDE project homepage you can find background information on the SMART ALTITUDE project itself and specifically the objective of the SMART ALTITUDE WebGIS. In WIKIAlps you can find articles on <font inherit/inherit;;inherit;;#f1c40f>ES themes in general as well as detailed descriptions of the ES indicators (that are AlpES project results)</font> available in this WebGIS.
Basic introduction
 Getting Started follow the basic instruction – click on the question-symbol on the right hand side in the grey bar on the top.
Create your own map
Choose layers
Choose layers
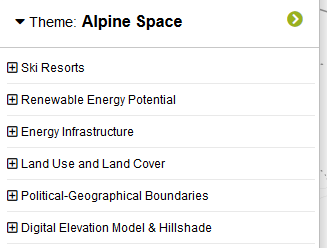
In the menu tree on the left hand side you find all datasets, which are available in the WebGIS organized by content. You can fold out and up the menu clicking on the field “Theme”. <font inherit/inherit;;inherit;;#2ecc71>In the menu categoies you find topics concerning the SMART ALTITUDE project</font> data results, that shall be made accessible to the public with this WebGIS tool. <font inherit/inherit;;inherit;;#2ecc71>Other data can</font> be used as background/additional information.
Activate layers
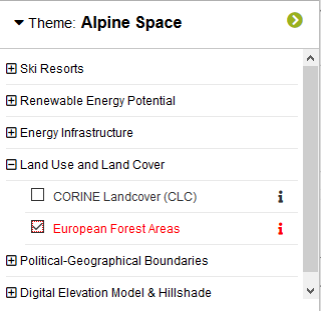
Clicking the checkbox on the left of the layer name will activate the layer. A pre-styled visualization of that layer will appear on the map.
Get legend and further information
![]() For further information on a specific layer click on that information symbol (i).
For further information on a specific layer click on that information symbol (i).
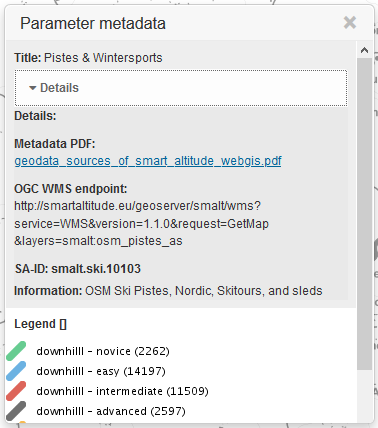
The box “Parameter metadata” will appear. There, you'll see the map legend, the data source and additional metadata. <font inherit/inherit;;inherit;;#f1c40f>In the case of project results, the so called ecosystem service indicators (listened first in the menu tree), a link to WIKIAlps is included in the “Details” section. In WIKIAlps you'll find a more detailed layer description of the dataset and its computation, what is important for their interpretation.</font>
Download of project results
 All project results (ES indicators) can be downloaded by clicking on the blue download symbol in the upper right corner of the parameter info box. Note that this will give you a csv file for the whole Alpine Space. If you only want the data for a specific municipality, download the data after selecting that municipality in that parameter info box (see select function below).
Change view extent
Choose the default extent
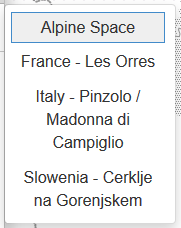
You can choose whether your default extent should be the whole Alpine Space or a specific test regions extent. The default theme “Alpine Space” means, that you'll see the data in the extent of the Alpine Space (<font inherit/inherit;;inherit;;#f1c40f>green default line on the map</font>). You can also zoom to one of the pre-defined <font inherit/inherit;;inherit;;#2ecc71>three</font> test regions of the SMART ALTITUDE project, selecting one of them clicking on the “Theme” bar and then on the chosen one.
Zoom to a specific municipality

Use the search tool if your region of interest is a specific municipality (LAU 2 unit). Type in the name considering the proposal(s) below that will appear while typing. Select one of those. The extent will be immediately zoomed to the extent of the selected municipality.
Zoom in and out

Use the plus (+) and the minus (-) symbol on the right hand side of the mapping window to zoom in and out or use your mouse scroll wheel doing the same job. Clicking on the E-symbol brings you directly to the outer extent of the selected theme.
Full screen
 To use the SMART ALTITUDE WebGIS in full screen modus click on this symbol below the zooming tools.
Styling of your map
Change background map
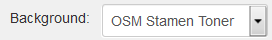 To change the background map click on the “Background” drop down menu on the right hand side in the grey bar on the top of the website. Choose your preferred background map.
Change layer properties

In the layer properties, you find below the menu tree, you can change the transparency as well as the drawing order of individual layers on the map. This are styling possibilities, while generating your own map, for the optimal layer view. Move the slider to change the transparency from 0 to 100%. Use the arrows on the right hand side to change the drawing order of the layers. Click on an upward arrow to bring the layer one level higher.
Get information about specific locations/areas
Get single area's attributes

<font inherit/inherit;;inherit;;#f1c40f>To select and inform you about a single polygon/municipality/area/map object, just click once on that object. The selected object will be coloured yellow and the parameter info box appears. There you can find all information you might be looking for. In the parameter info box the information of all activate layers on your cursor position will be listend. For the project results, the ecosystem service indicators, you'll find the demand, supply and flow values for the selected ecosystem service.</font>
Download of ecosystem service indicators of a single municipality
Selecting a single municipality, you then can download the ecosystem service indicators specifically for that selected municipality clicking on the blue download symbol in the related parameter info box.
Get coordinates from a specific location
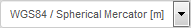
If you want to look for a specific location or to get the coordinates of a specific location, first change the coordinate system in the “Coordinate” drop down menu to the one you need your coordinates to be in. Moving your mouse cursor on the mapping window, you'll see the corresponding coordinates besides the “coordinate” box in the narror grey bar.
Save your results
Return to your personalised view
Return to your own WebGIS view/map by saving the web address (URL) as favorite or bookmark (depending on the used browser).
Print your own map
 The print button/bar on the top of the menu tree allows you to convert your current own map to the pdf format. Of course you can save and print that pdf.
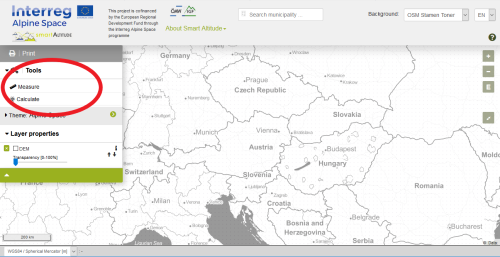
Calculation Tool
1) The Calculation tool (together with the measurement tool) is accessible via the 'Tools' section in the navigation panel.
2) The calculation dialog opens with the following elements:
- The expression box: A user can define the expression here. SMART ALTITUDE layers can be dragged and dropped from the layer tree into this box, which will result in the 5-digit SMART ALTITUDE layer code with a '_' character prefix, pasted into the field. Valid operators and functions can be found here
- The clear text expression label which shows the expression entered in (1) with clear text variable names indicating the layer label.
- The validation button: to check the expression syntax and populate the statistic fields below. Statistic fields below are provided for the user as a quick sanity check of the correctness of the expression. Only if the validation is successful, the 'Create Layer' button (5) will become active.
- Messages to the user like a validation/error are being displayed here
- The 'Create Layer' button to create the user layer and display it on the map. The layer will be inserted into the 'Layer properties' list of active layers on the navigation panel. Depending on the complexity of the formula and the classification method, layer creation can take up to ~10seconds.
- Expression Import and Export buttons: Expressions and corresponding styling can be saved to and imported from the local computer. This function allows sharing of expressions and user layers with other user. Not yet implemented.

3) The result is displayed on the map and the layer is available in the layer stack. Here the layer can be removed. 
Have fun generating your own SMART ALTITUDE related maps in the Alpine Space!
Your IGF-Team: Cziferszky, Andreas; Nadine Houbé, MSc; Annemarie Polderman, PhD; Andreas Haller, PhD; PD Dipl.-Geogr. Dr. Oliver Bender